
Dashboards and reports #
Management does not need to ask for status updates. Dashboards show what is happening now, and Reports give the numbers for a period. They appear in the menu for people whose profile includes them, and show the hotel selected in the header.
Dashboards #
Dashboards (in the menu) lists the dashboards you may open. The demo hotel has 13: Hotel Overview, Reservations & Events, Guest Experience, Rooms & Operations, Night Audit & Income, Quality & Internal Audit, Procurement & Stores, Sales & Revenue, People & Security, Records & Compliance, External Audit and Staff Activity.
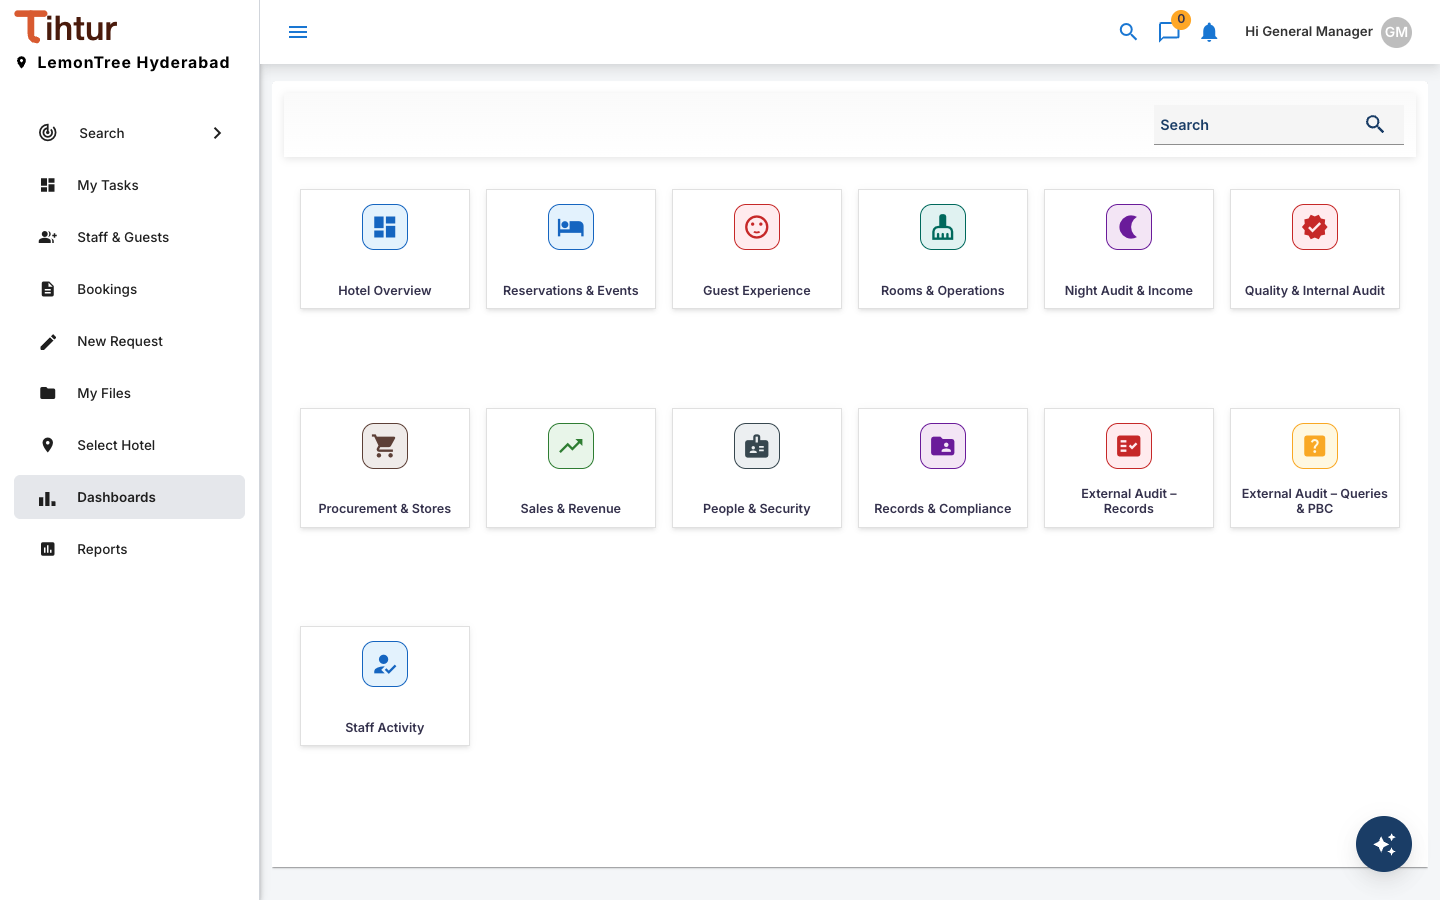
- Open Dashboards and choose a dashboard.
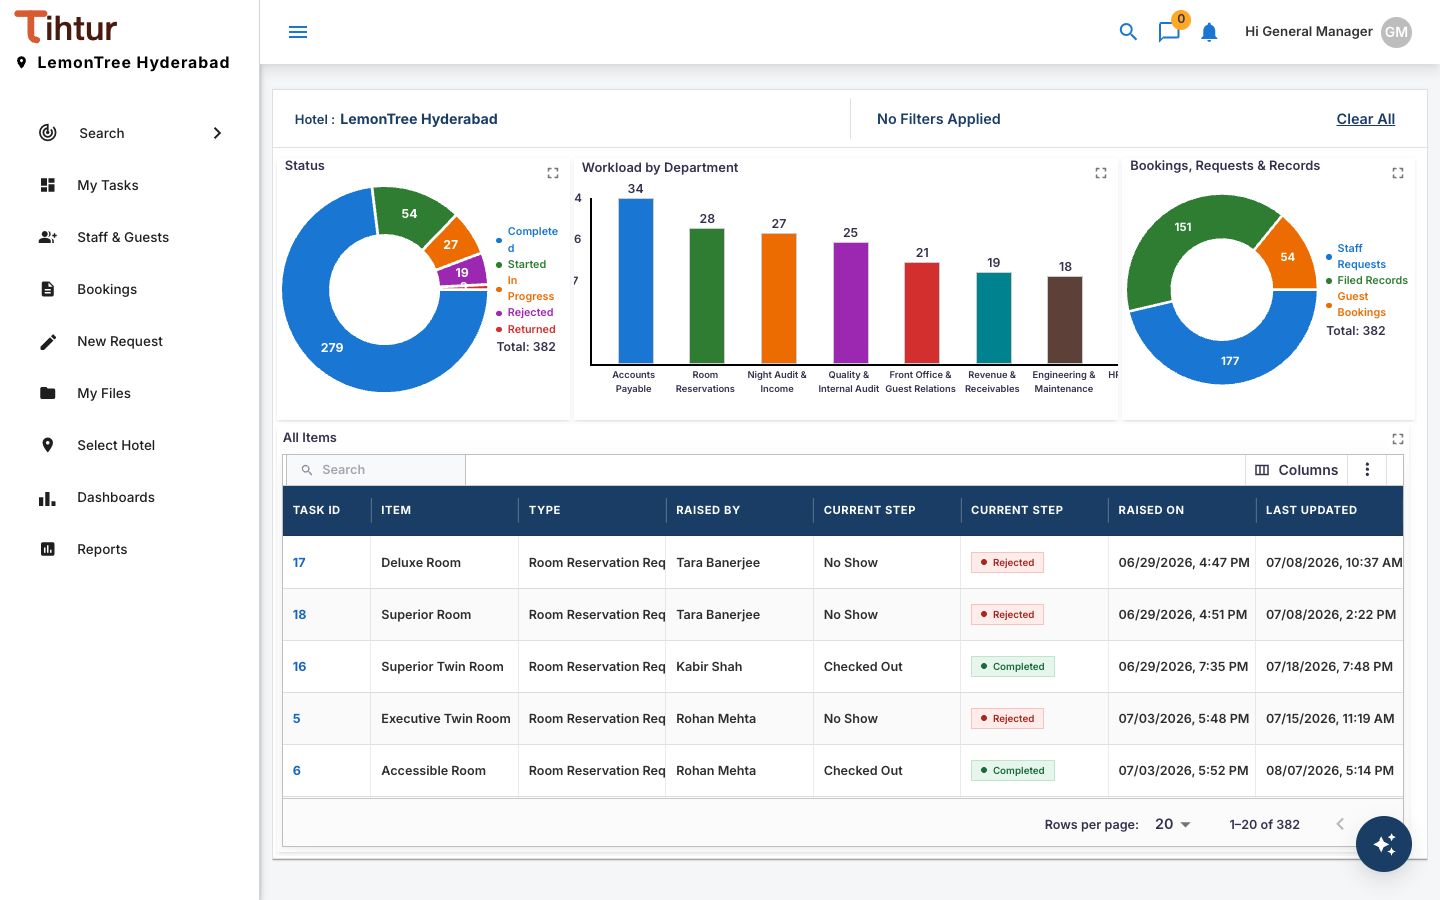
- Use the filters at the top, then Submit, or Clear All to reset.
- Click a figure or a row to see the tasks behind it.
Reports #
Reports are statements for a period, laid out the way an accountant or auditor expects. The demo hotel has 23:
| Category | Reports |
|---|---|
| Finance | Profit & Loss Statement, Night Audit & Cash Control, Management Accounts vs Budget, Payables & Vendor Ageing, City Ledger & Receivables |
| Rooms & Revenue | Daily Revenue & Rooms Performance, Reservations & Booking Mix, OTA Commission Statement, Banquets & Events, Dining & Spa |
| Food & Beverage | F&B Cost, Stock & Stores, Procurement & Goods Receipt |
| Guest Experience | Guest Complaints & Service Recovery |
| Compliance | GST, TDS & Statutory Filings, Licences, Contracts & Insurance Expiry |
| Quality & Audit | Quality Audits & CAPA, Food Safety: HACCP Log, External Audit: Queries & PBC |
| People | Staff Leave, Training & Joining |
| Operations | Pending Approvals & SLA, Rooms & Engineering, Security Incidents |
Running a report #
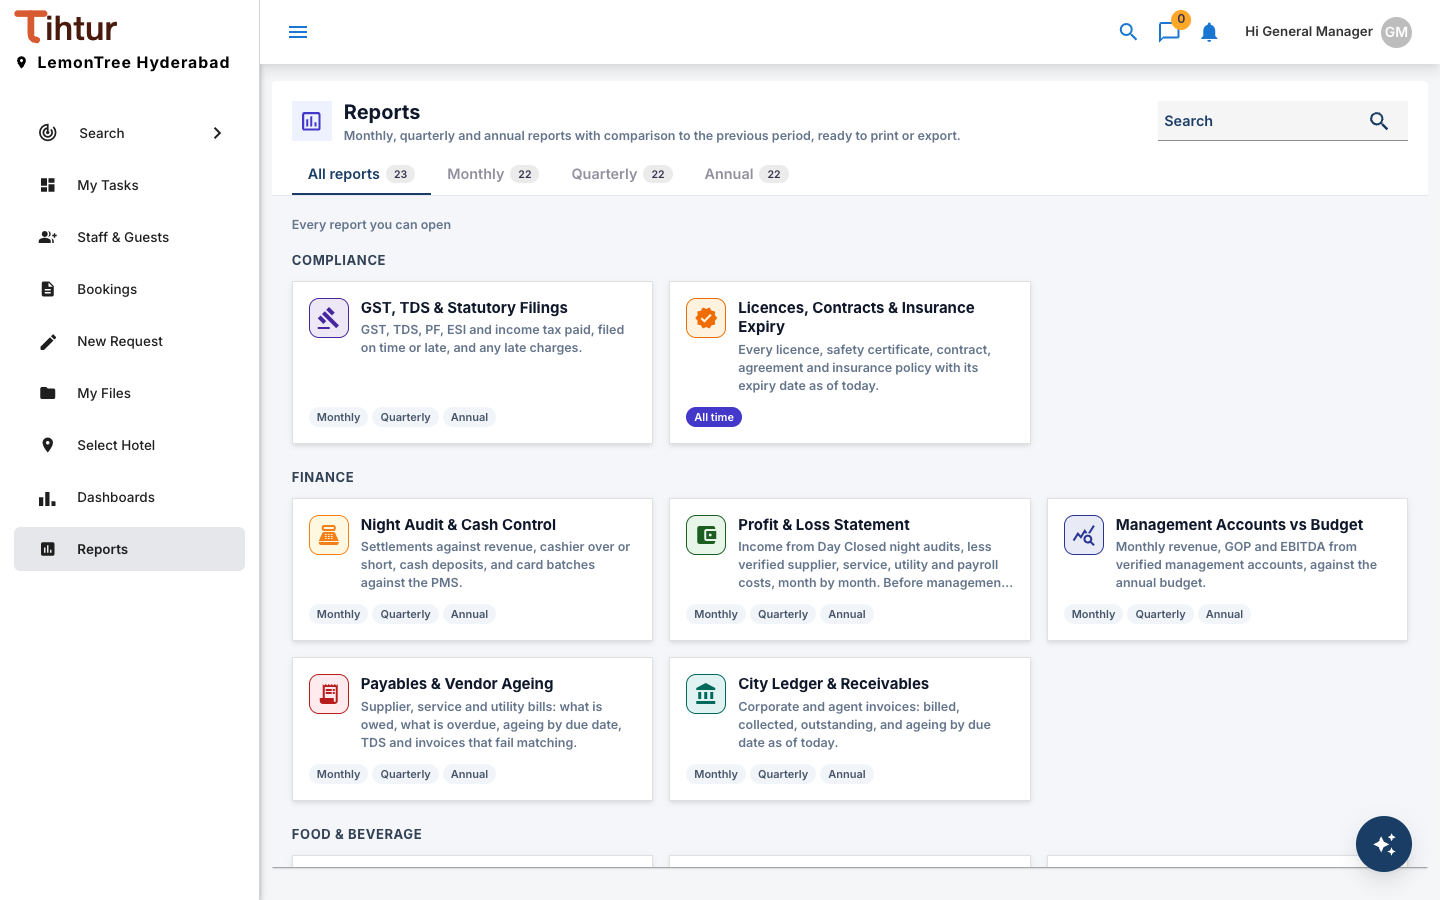
- Open Reports. Use the tabs for All reports, Monthly, Quarterly or Annual ones, or Search by name.
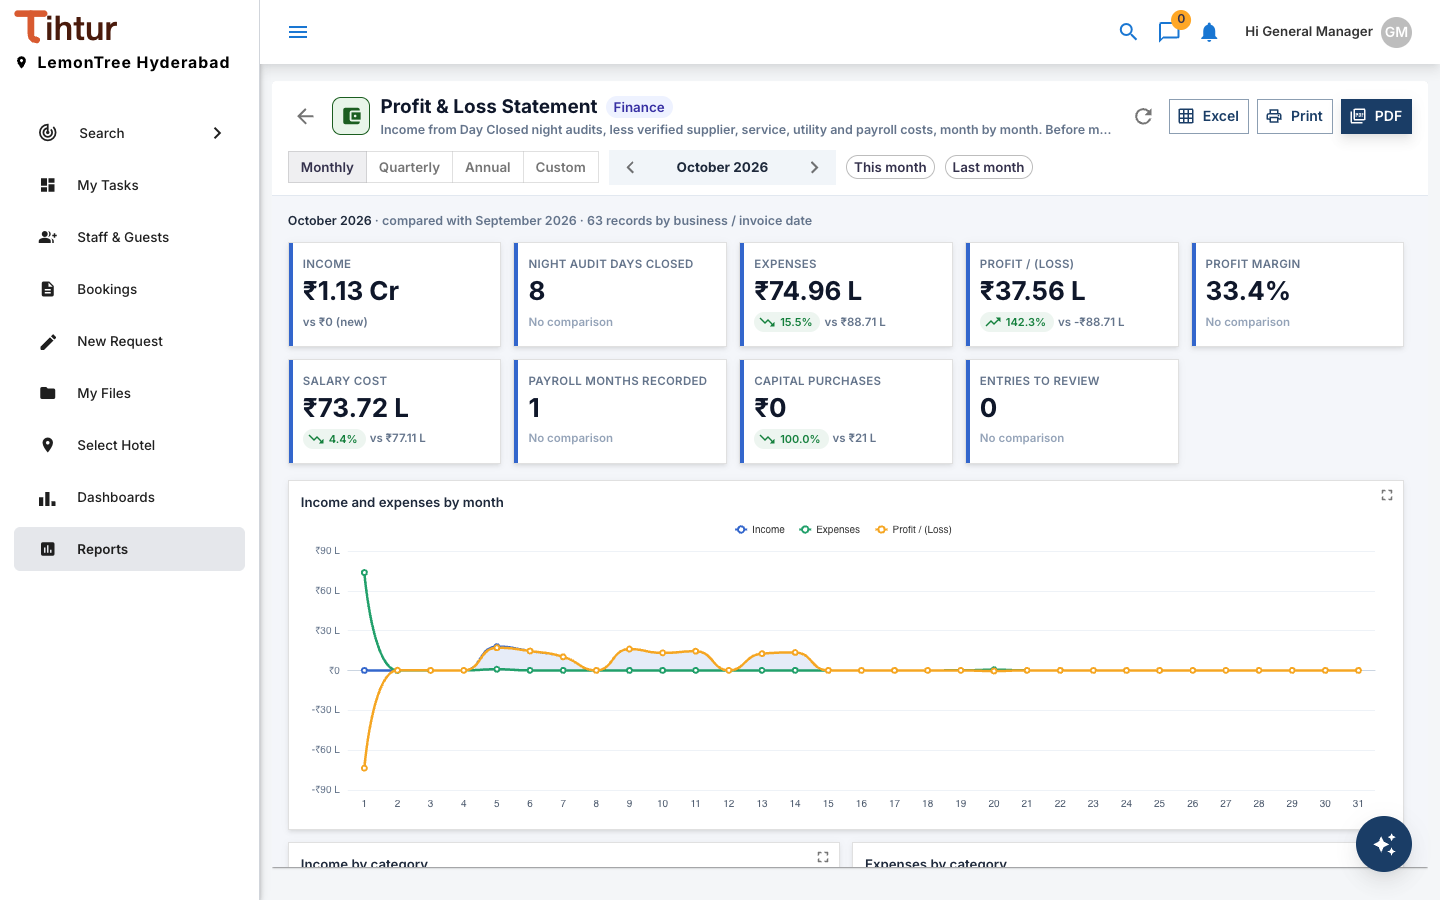
- Choose the period (From and To), any filters, and optionally a comparison period.
- How this report is calculated explains every figure. Excel downloads the table, Print gives a print-ready page, and PDF saves one.
Numbers come from the tasks. A document that was never filed, or a request that was never approved, is not counted.