
Dashboards #
Dashboards (control centers) are live views over tasks and their tags. The demo hospital has 21. They are built under Control Centers and opened from Dashboards.
Create a dashboard #
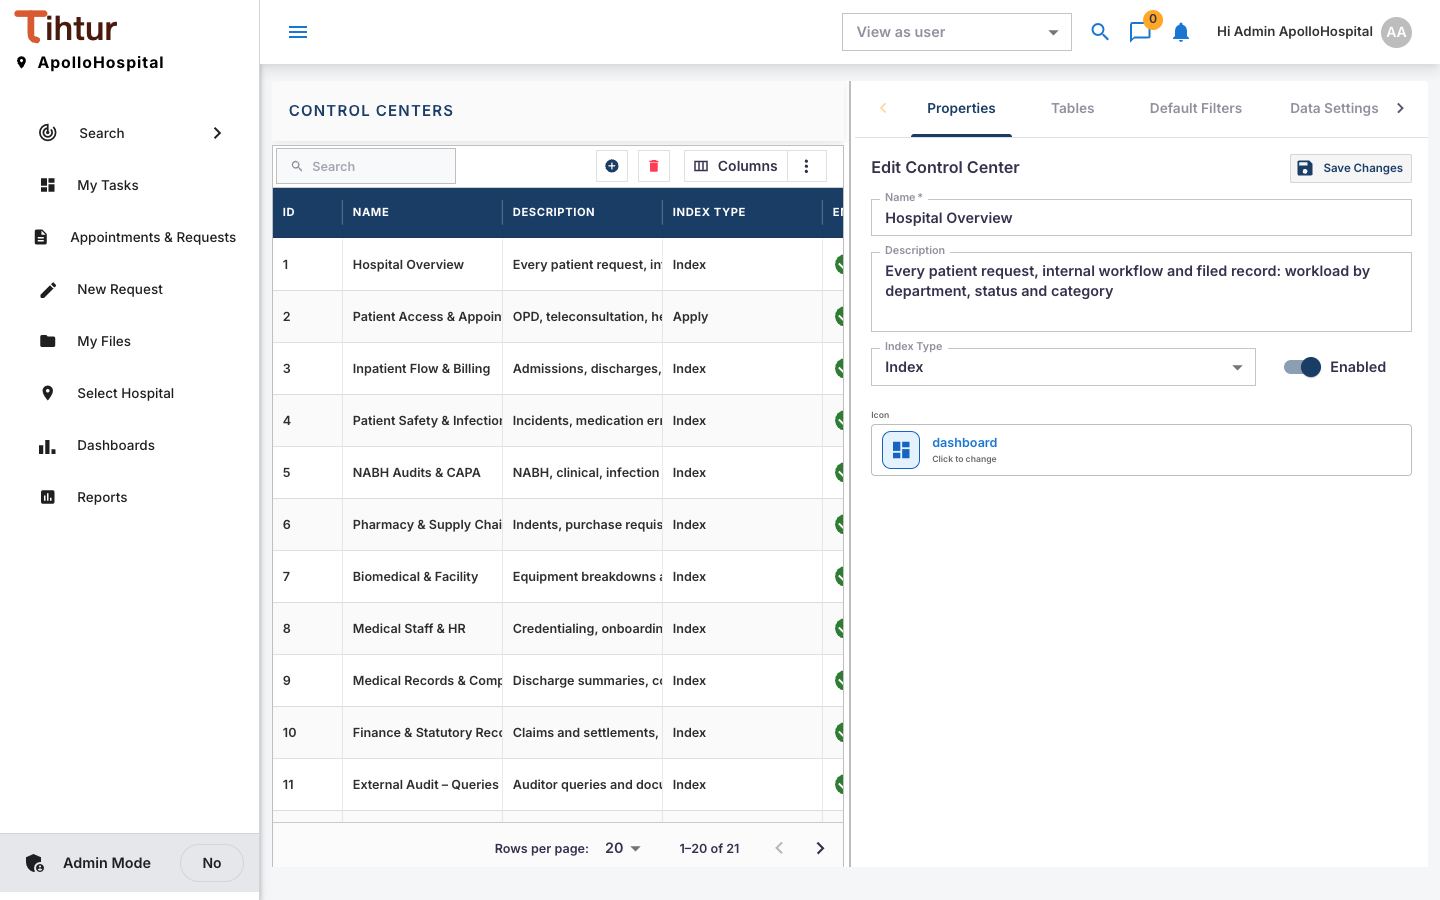
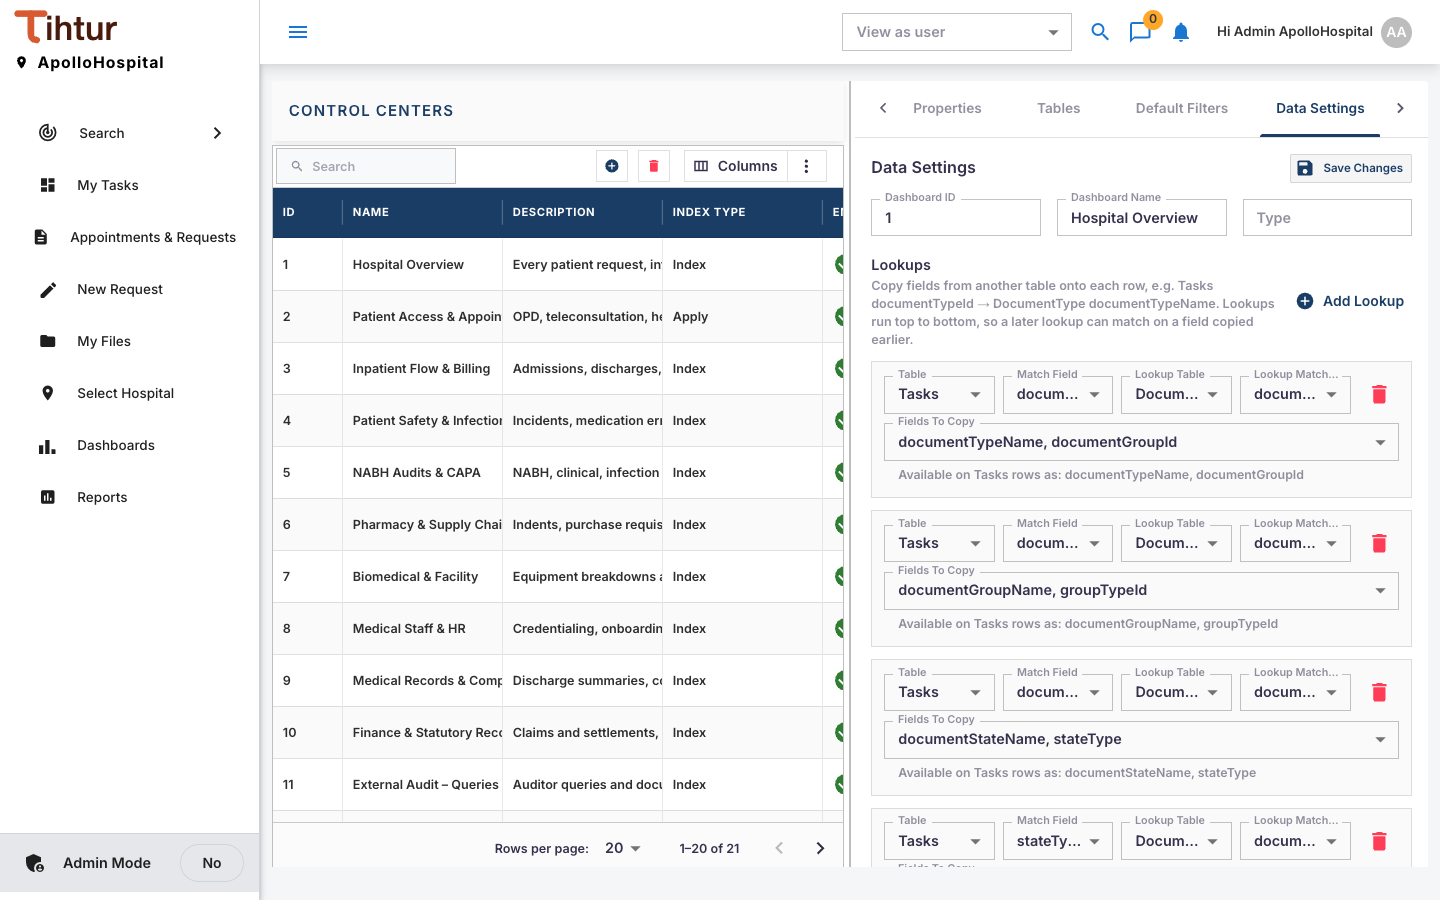
- Open Control Centers and press the add button. The editor has the tabs Properties, Tables, Default Filters and Data Settings.
- Properties: Name, Description, Index Type, Enabled.
- Data Settings: the Tables to read; Conditions (all or any must match; Equals, Contains, Greater Than, Is Empty …); Computed Fields (Count of rows, Sum, Average, Minimum, Maximum of field); Lookups for names from data tables; Default Filters shown to users.
- Run Preview to check; Execution Log shows what ran.
- Security: the roles that can open it. Save Changes.
Users see Dashboards when their profile includes ControlCenters, and then only the dashboards their roles allow.
Ideas #
| Dashboard | Shows |
|---|---|
| Patient access | OPD and health check bookings by day and status |
| Inpatient flow | Admissions, transfers and discharges, pending bills |
| Patient safety | Incidents, medication errors and infections by department |
| NABH audits & CAPA | Audit findings and open corrective actions |
| Payables | Supplier invoices by status, due date and three-way match |
Dashboards are only as good as the tags. If a figure is missing, add the tag first so staff start recording it.
Next: 12. Reports