
Dashboards #
Dashboards (also called control centers) are live views over the school's tasks and their tags: how many admissions per class, fees collected this month, leave pending with the Principal. The demo school comes with 26.
Dashboards are built under Control Centers in the admin menu, and opened by users from Dashboards.
Create a dashboard #
- Open Control Centers and press the add button. The editor has the tabs Properties, Tables, Default Filters and Data Settings.
- Properties: give it a Name, a Description, the Index Type, and tick Enabled.
- Data Settings: choose what it shows.
- Tables: the document types (and their tags) to read from.
- Conditions: which tasks count, for example Status Equals Approved. Choose All conditions must match or Any condition can match. Comparisons include Equals, Not Equals, Contains, Starts With, Greater Than, Less Than and Is Empty.
- Computed Fields: the figures to show, using Count of rows, Sum of field, Average of field, Minimum of field or Maximum of field. For example Sum of Amount for fee collection.
- Lookups: bring in names from a data table, for example the class name for a class code.
- Default Filters: filters the user sees at the top, for example month or class.
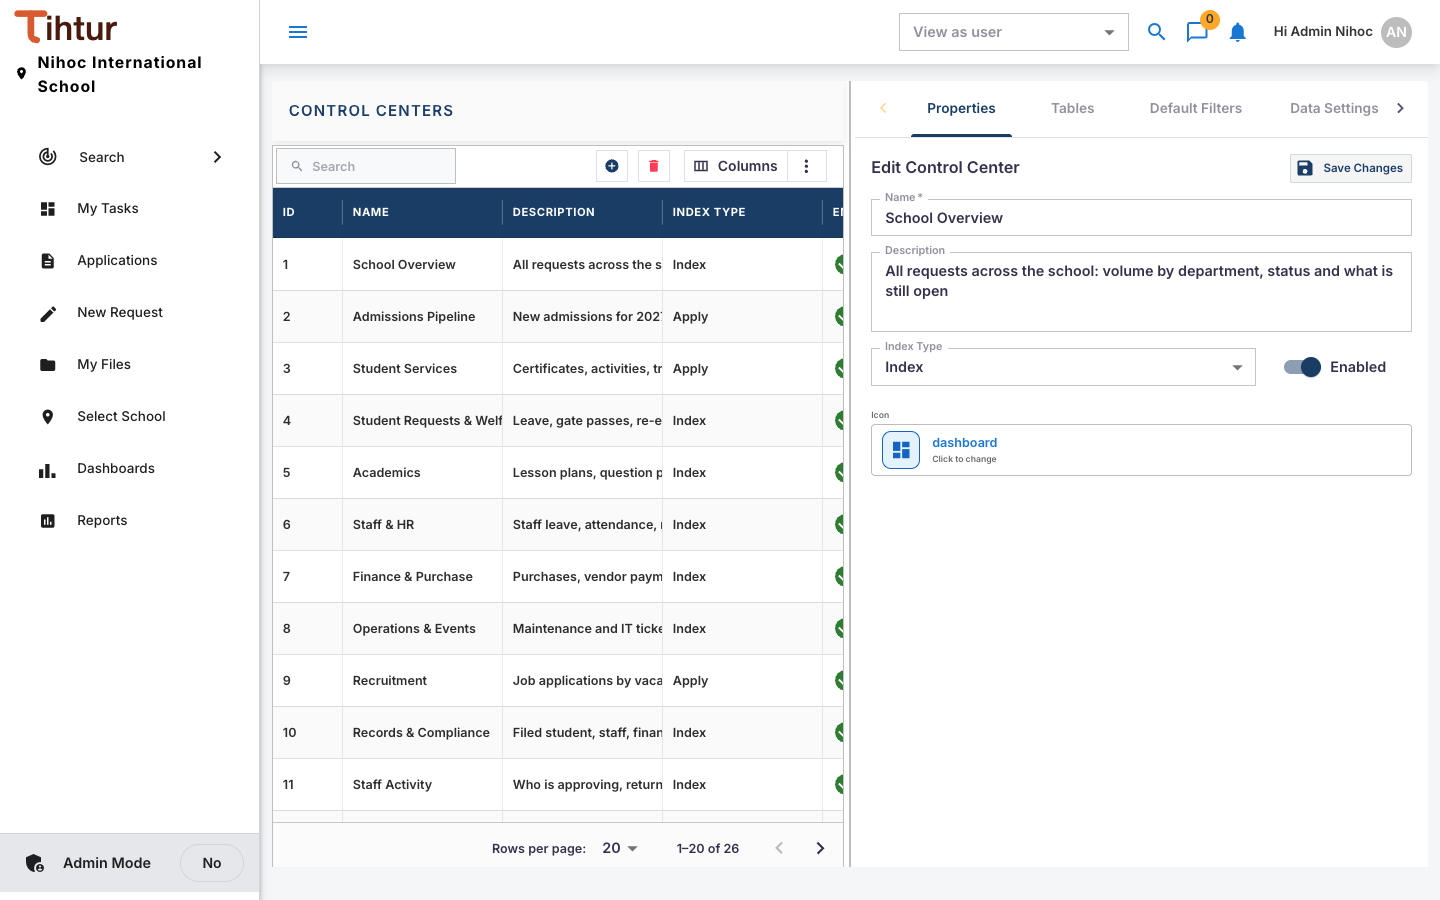
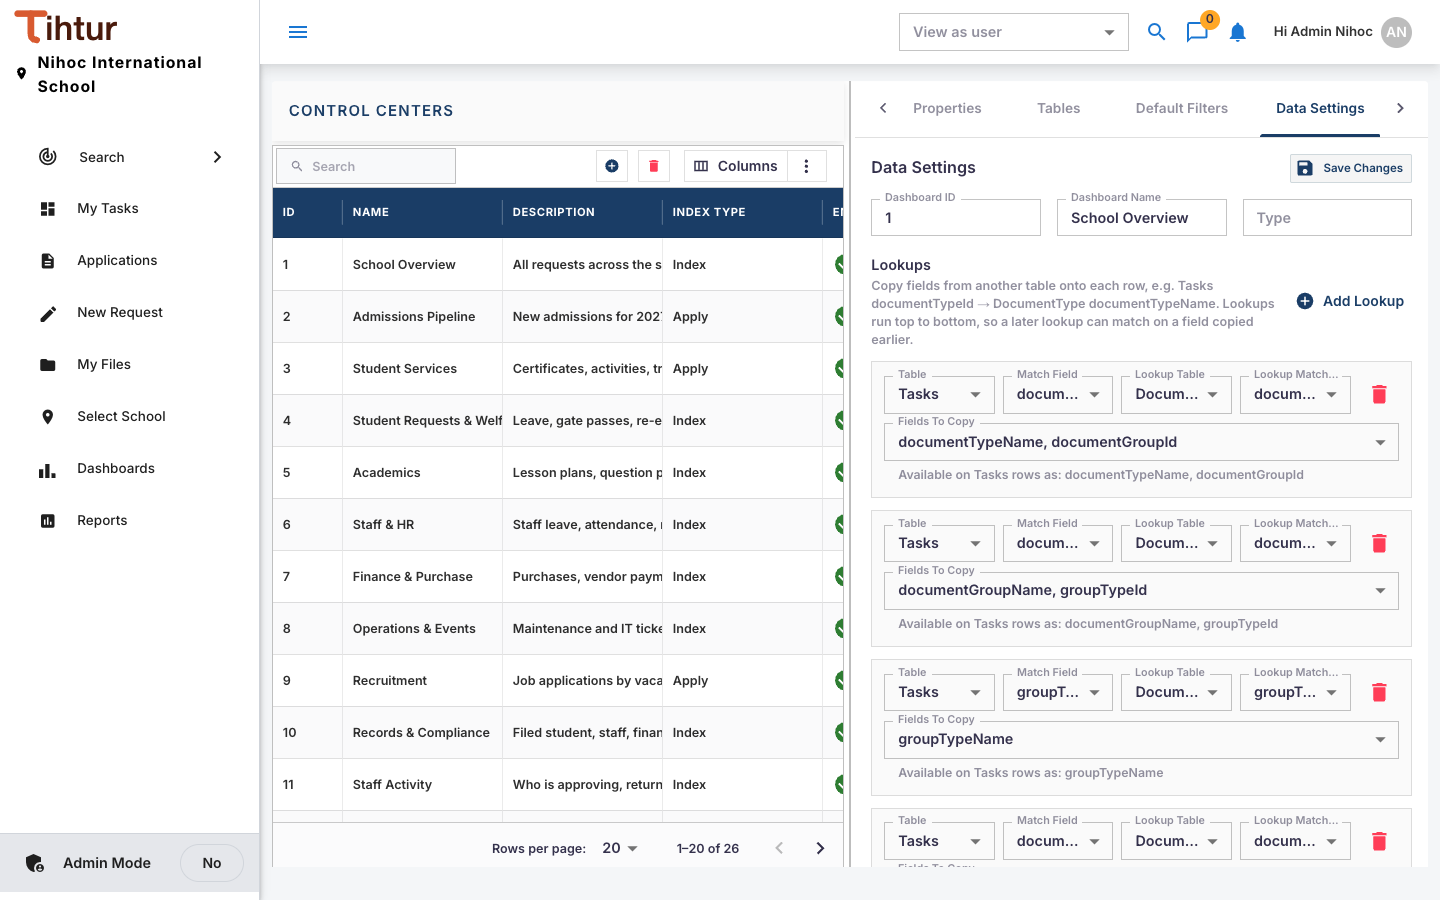
- Press Run Preview to check the numbers. Execution Log shows what was run if something looks wrong.
- Security: choose the roles that can open this dashboard.
- Press Save Changes.
Who sees dashboards #
A user sees Dashboards in the menu when their profile type includes ControlCenters (Profile types), and then only the dashboards their roles are allowed under Security.
Dashboards always show the school selected in the header.
Ideas for a school #
| Dashboard | Shows |
|---|---|
| Admissions pipeline | Applications by class and step, conversion to admitted |
| Fee collection | Collected this month by fee type and payment mode, against the schedule |
| Pending approvals | Tasks waiting, by approver and age (On time / Attention / Critical) |
| Staff leave | Leave by department and type, days approved |
| Welfare and discipline | Incidents by class and severity |
Dashboards are only as good as the tags. If a figure is missing, add the tag to the document's tag form first, so staff start recording it.
Next: 12. Reports