
Dashboards and reports #
Management does not need to ask for status updates. Dashboards show what is happening now, and Reports give the numbers for a month, a quarter or a year.
Both appear in the menu for people whose profile includes them, and always show the school selected in the header.
Dashboards #
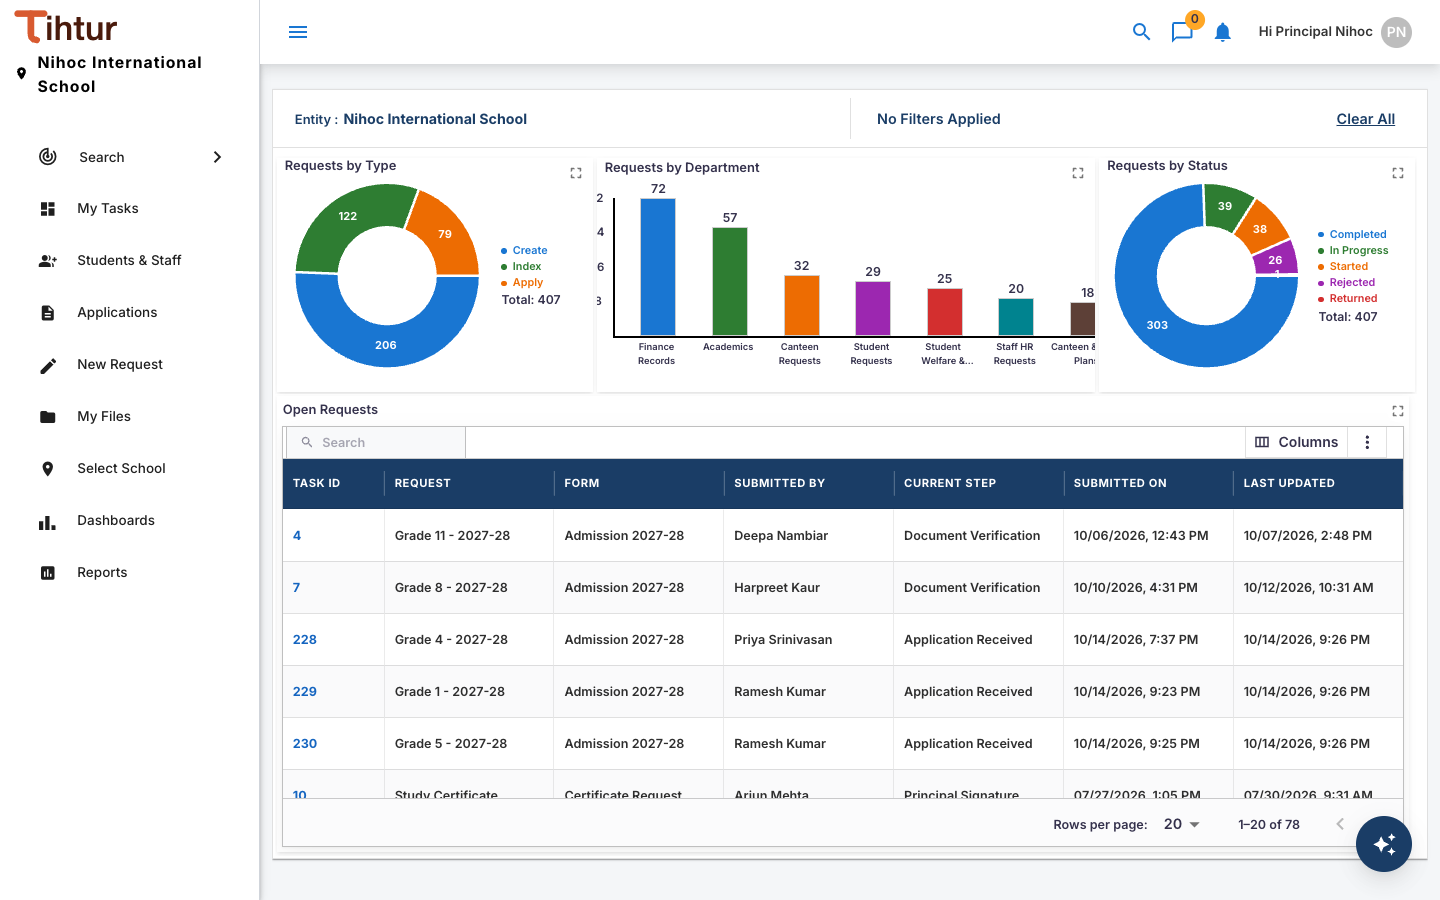
Dashboards (in the menu) lists the dashboards you are allowed to open. The demo school has 26, for example admissions, fee collection, staff leave, discipline and welfare, transport and pending approvals.
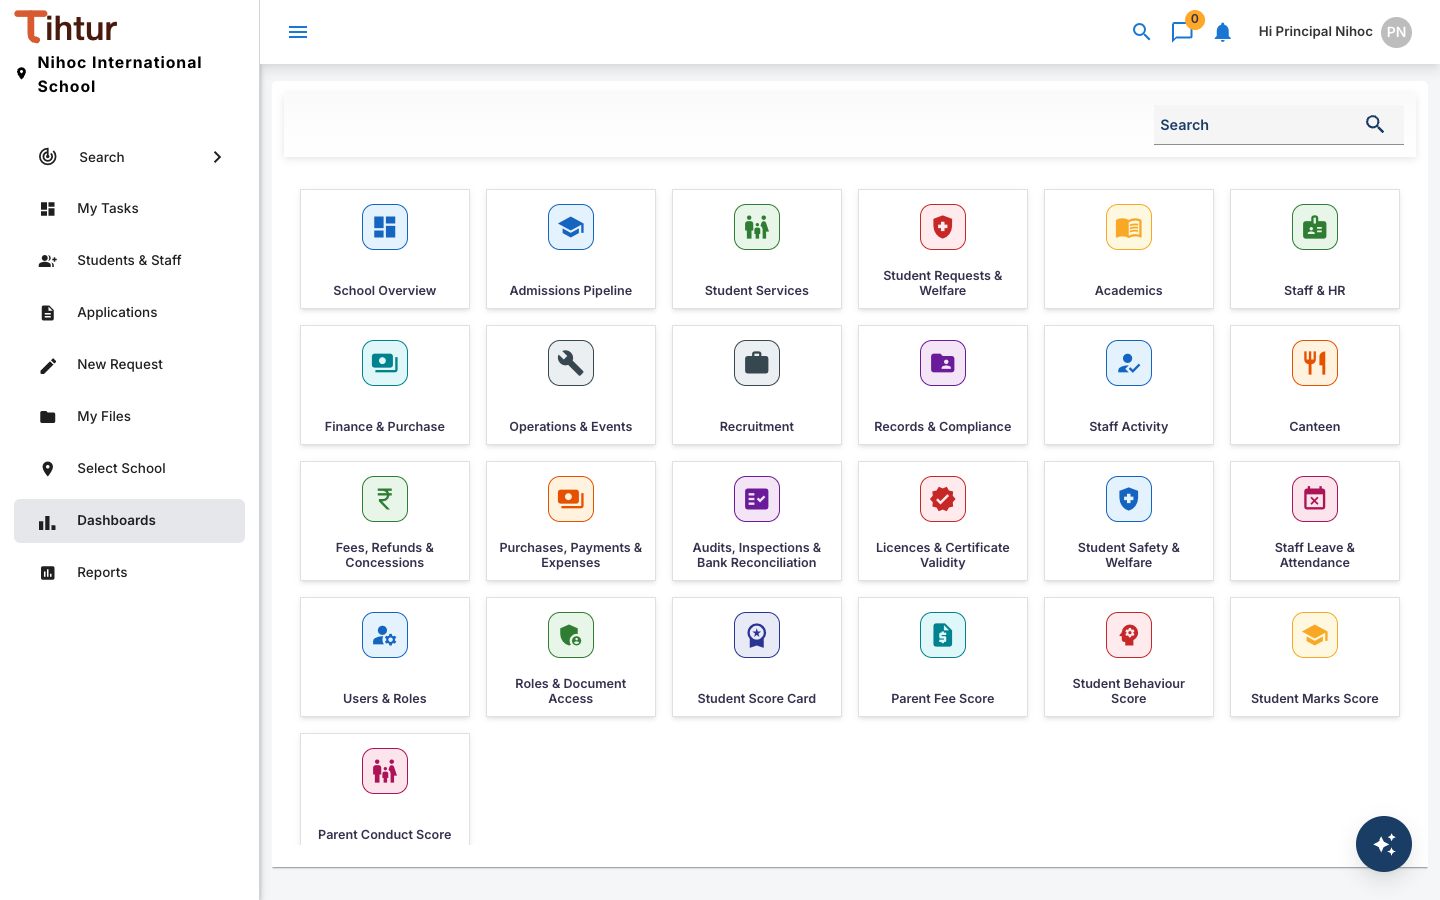
- Open Dashboards and choose a dashboard.
- Use the filters at the top to narrow it down, for example by class, month or status. Press Submit to apply them, or Clear All to reset.
- Click a figure or a row to see the tasks behind it.
Reports #
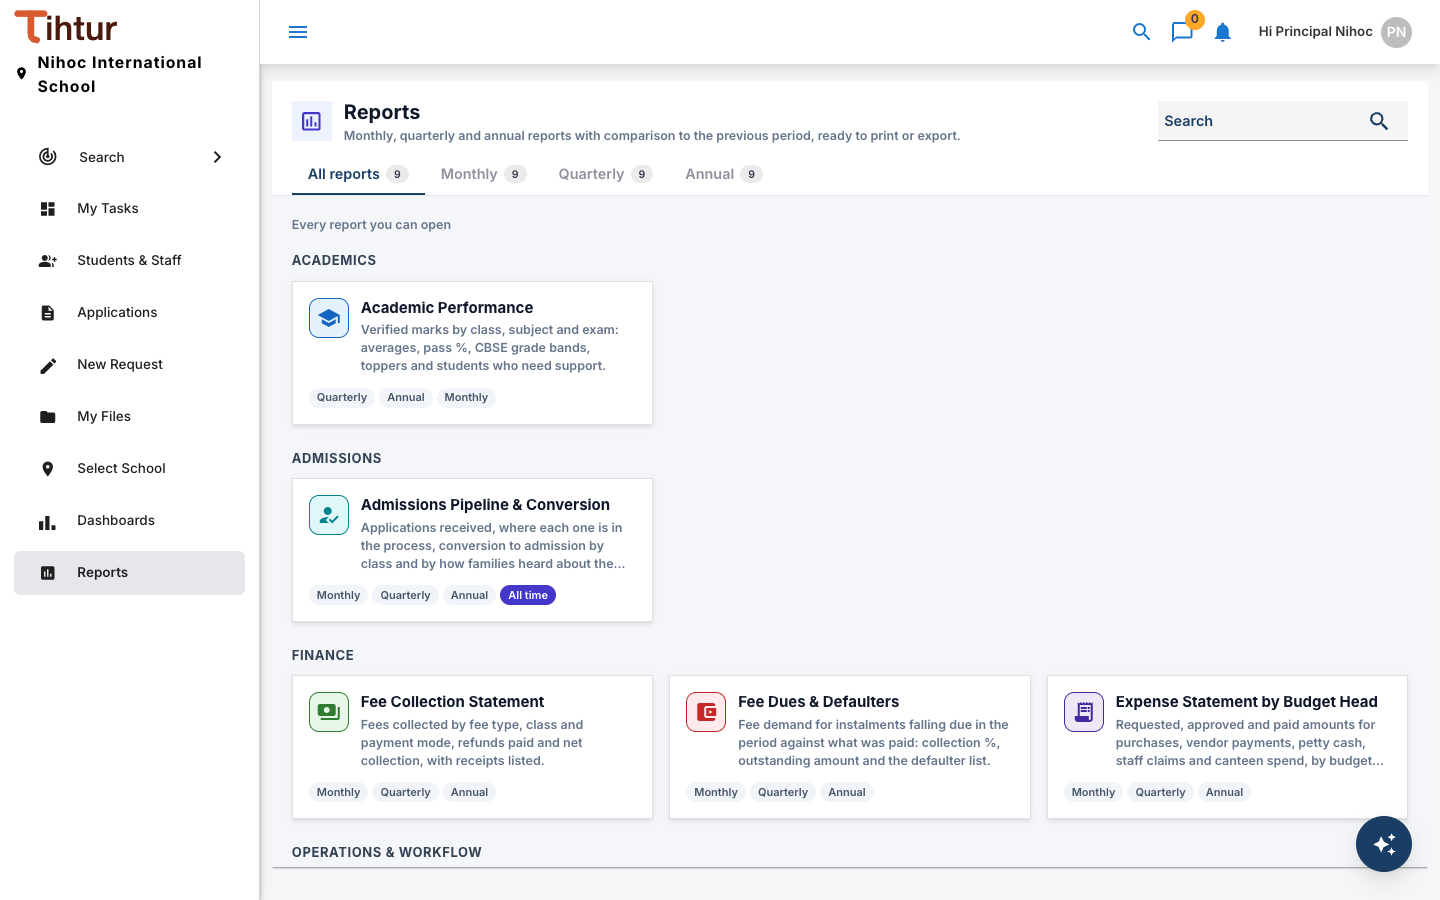
Reports are statements laid out like the ones an accountant or auditor expects. The demo school's reports include:
| Category | Reports |
|---|---|
| Finance | Fee Collection Statement, Fee Dues & Defaulters, Expense Statement by Budget Head, Profit & Loss Statement |
| Admissions | Admissions Pipeline & Conversion |
| Academics | Academic Performance |
| People & HR | Staff Leave & Attendance |
| Student Welfare | Discipline, Medical & Welfare Register, Complaints & Feedback |
| Operations & Workflow | Pending Approvals & SLA |
Running a report #
- Open Reports. Use the tabs to see All reports, the Monthly ones (for the office and accounts), the Quarterly ones (for management) or the Annual ones. Use Search to find a report by name.
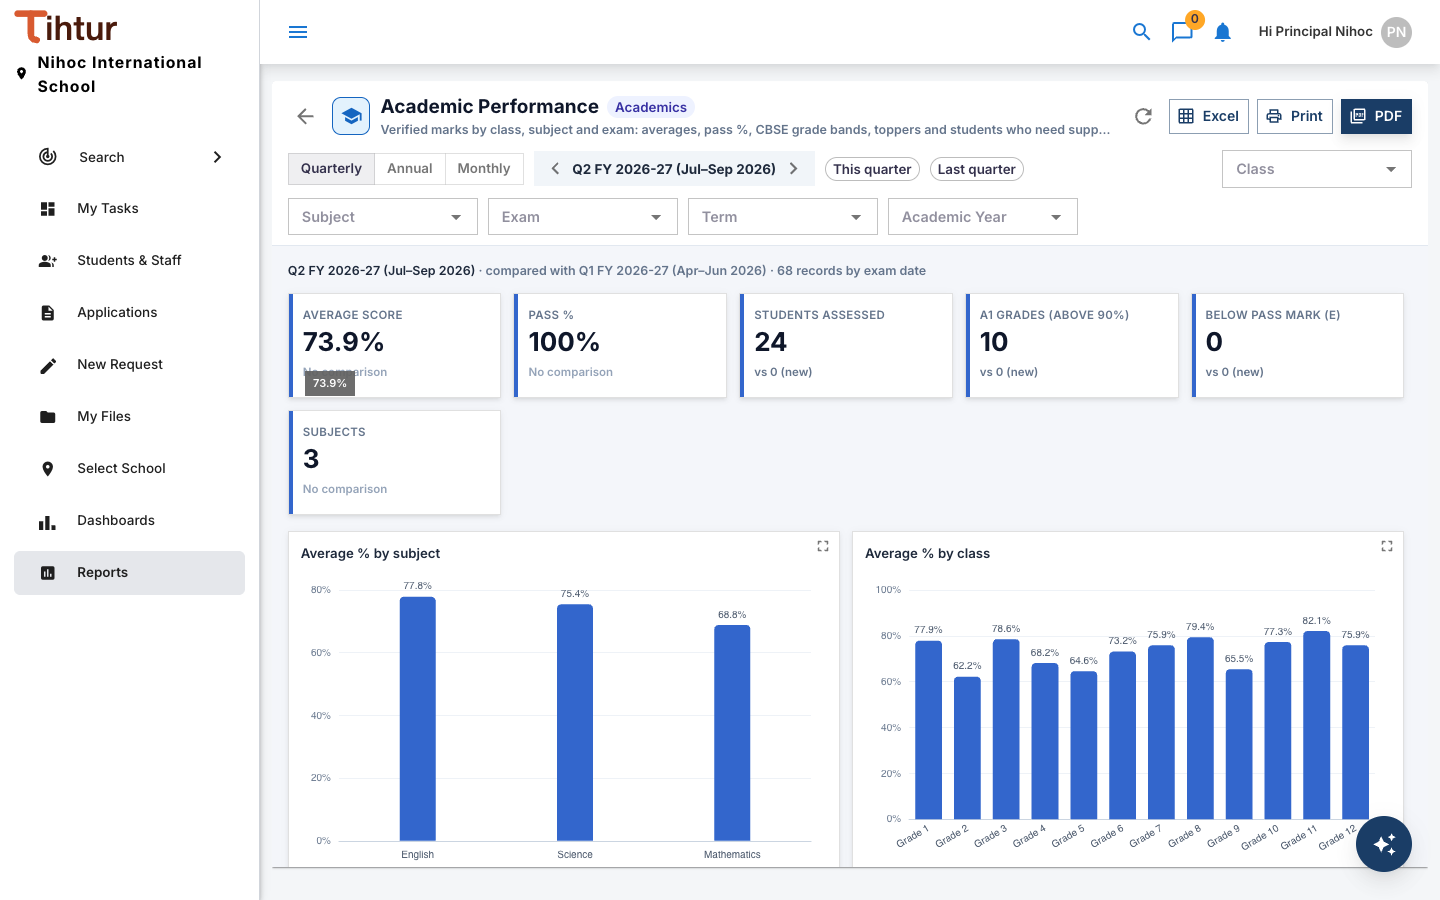
- Open a report and choose the period (From and To), plus any filters it offers.
- Choose a comparison period if you want to see the change against an earlier period.
- Read the totals and the charts. How this report is calculated explains every figure.
- Excel downloads the table (CSV, opens in Excel), Print gives a print-ready page, and PDF saves one.
Numbers come from the tasks. A fee receipt that was never filed, or a request that was never approved, is not counted. Good reports start with good filing.